
Have an odd data set. Not sure how to chart it the way I want. Open to suggestions.
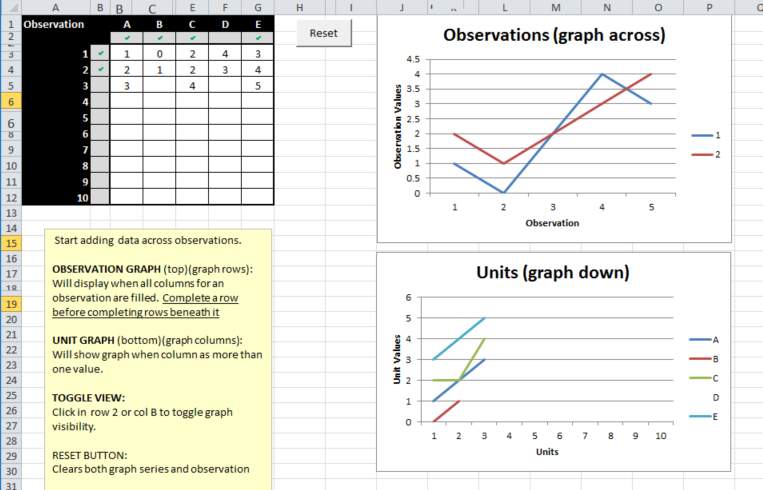
One variable is ordinal (first, second, third). I’d like that on the horizontal axis.
One variable is cardinal/ratio (0 to 10). I’d like that on the vertical axis.
No problem so far, right? I am thinking about an xy/scatter chart.
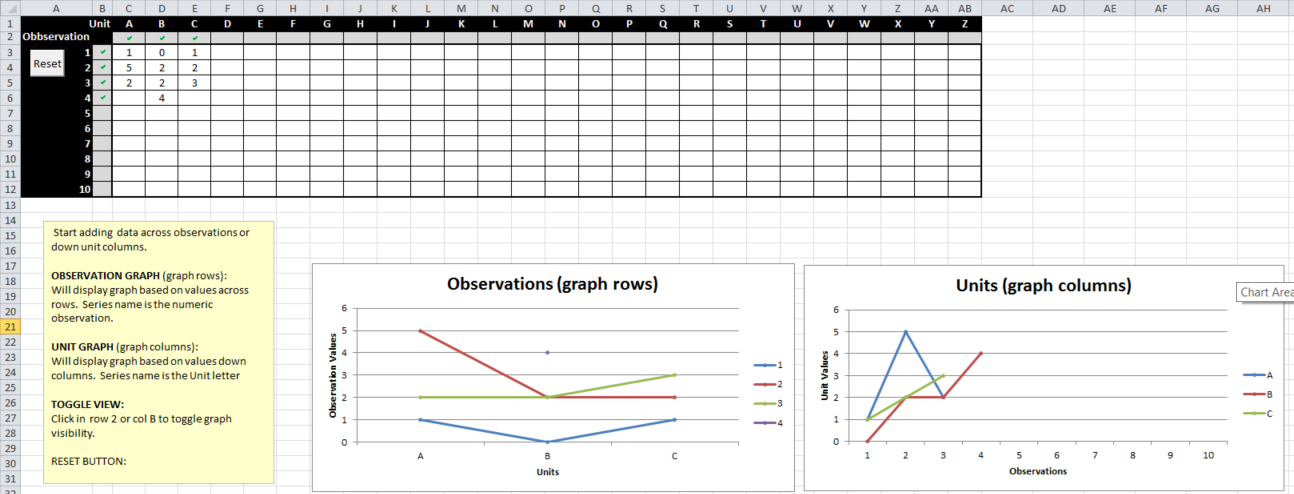
But, I have observations on units. Call them A, B, C.
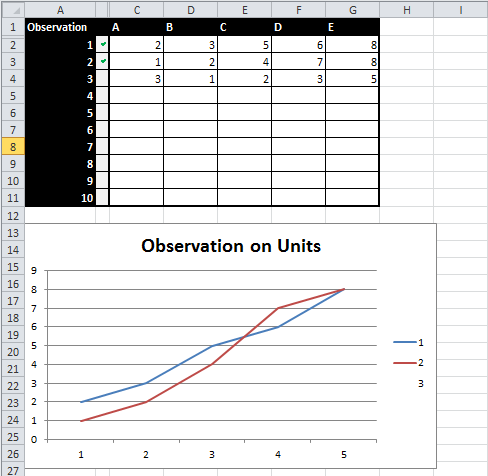
So on my first measurement, I might get 2,3,4 for A,B,C. Then on my second measurement I might get 6,4,5 for A,B,C. For my third, I might get 8,8,8 for A,B,C.
What I would like to do is de-emphasize the points, and emphasize the trend by connecting them with line segments. So, for A, I want a line that goes from 2 to 6 to 8. Then I want a separate line that goes from 3 to 4 to 8 for B, and so on.
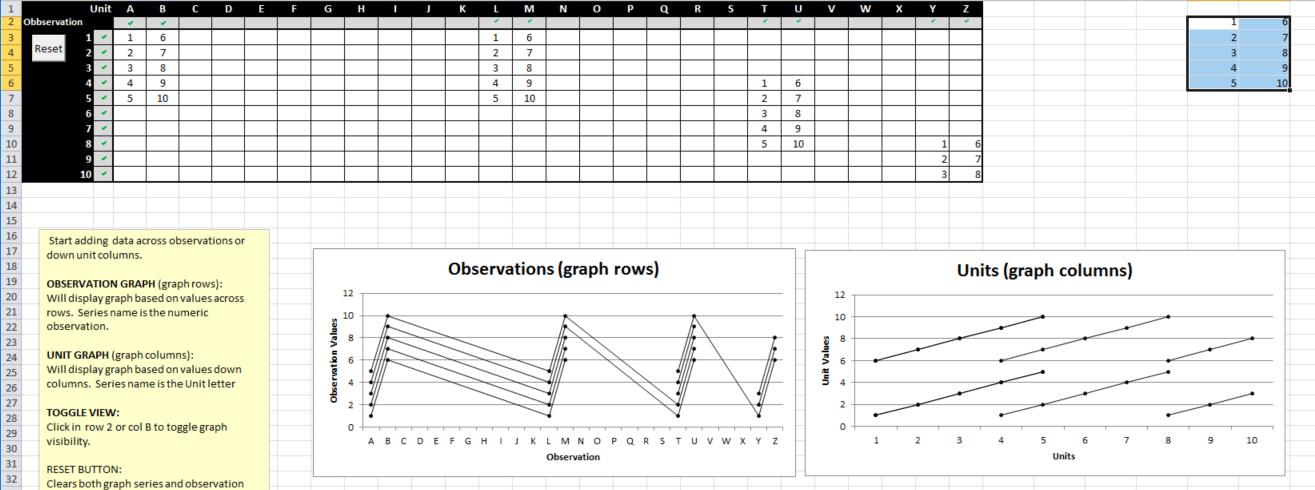
My problem is that I have many units that I make observations on (typically 100-200). Honestly, I’d probably like them all shown with the same color/symbol so that no particular one stands out.
This is a very simple thing to do with a small data set (see that attachment). My question is how I should set it up for a large number of observations so that my hand editing of the options on the chart is minimized?


